On this page
What we did
In collaboration with Professor Daniel Angus, experts from the QUT Digital Observatory sifted the Australian Twittersphere to identify all tweets that mentioned the COVID-19 pandemic, either through COVID-19 specific hashtags or keywords. The search terms included (but were not limited to) covid, corona, lockdown, and pandemic (case insensitive).
About 2.8 million tweets from the first 100 days of COVID-19 in Australia were identified. Weekly counts of the hashtags, mentions, and domains (from links/URLs included in the Tweet text) throughout the 100 day period were thematically coded into groups and subgroups. For example, the hashtag groups included coronavirus, geographical, government service, impact, media, medical, mitigation, narrative, organisation, panic buying, political, and unrelated. Within the impact group, the subgroups included economy, sport, travel, and education.
Data on COVID-19 cases and deaths in Australia were obtained from the ABC.
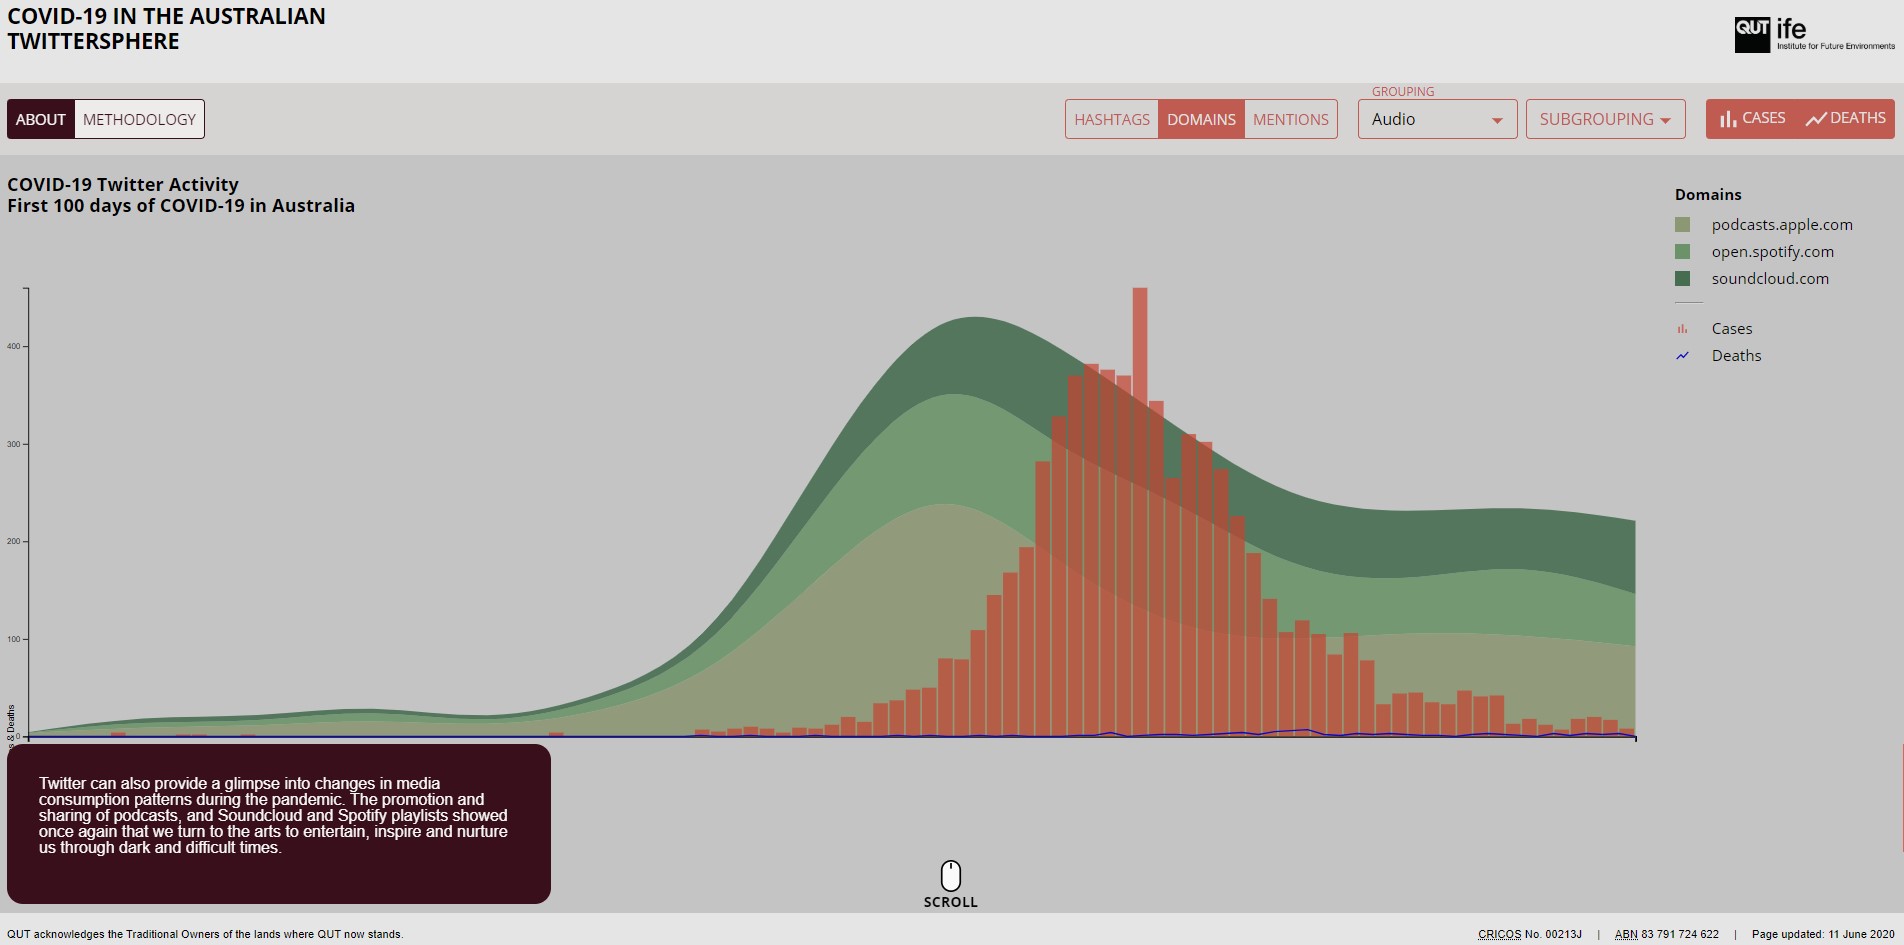
QUT's VISER (Visualisation and Interactive Solutions for Engagement and Research) lab then created an online, interactive visualisation of the data (see screenshot of the landing page below). The visualisation enabled users to view numbers of cases and deaths alongside the counts of hashtags, domains, and account mentions in each group and subgroup. The interactive app is no longer hosted and publicly accessible, but we have included several screenshots of the visualisation here.
What we found
Politicians
A core function of Twitter is the ability to tag, or @ mention, another user of the platform. Examining the mentions of our state, national and international leaders shows that it was our Federal politicians that received the bulk of attention. It was in early to mid-March when pressure mounted on Federal and State ministers to begin a shutdown of much of our nation. Prime Minister Scott Morrison’s initial defiance over the eventual shutdown of major sporting events and mass gatherings led to much discussion on Twitter about how seriously we would be able to contain the virus, and whether we would suffer the same fate as other nations who had failed to act swiftly.
Communicators
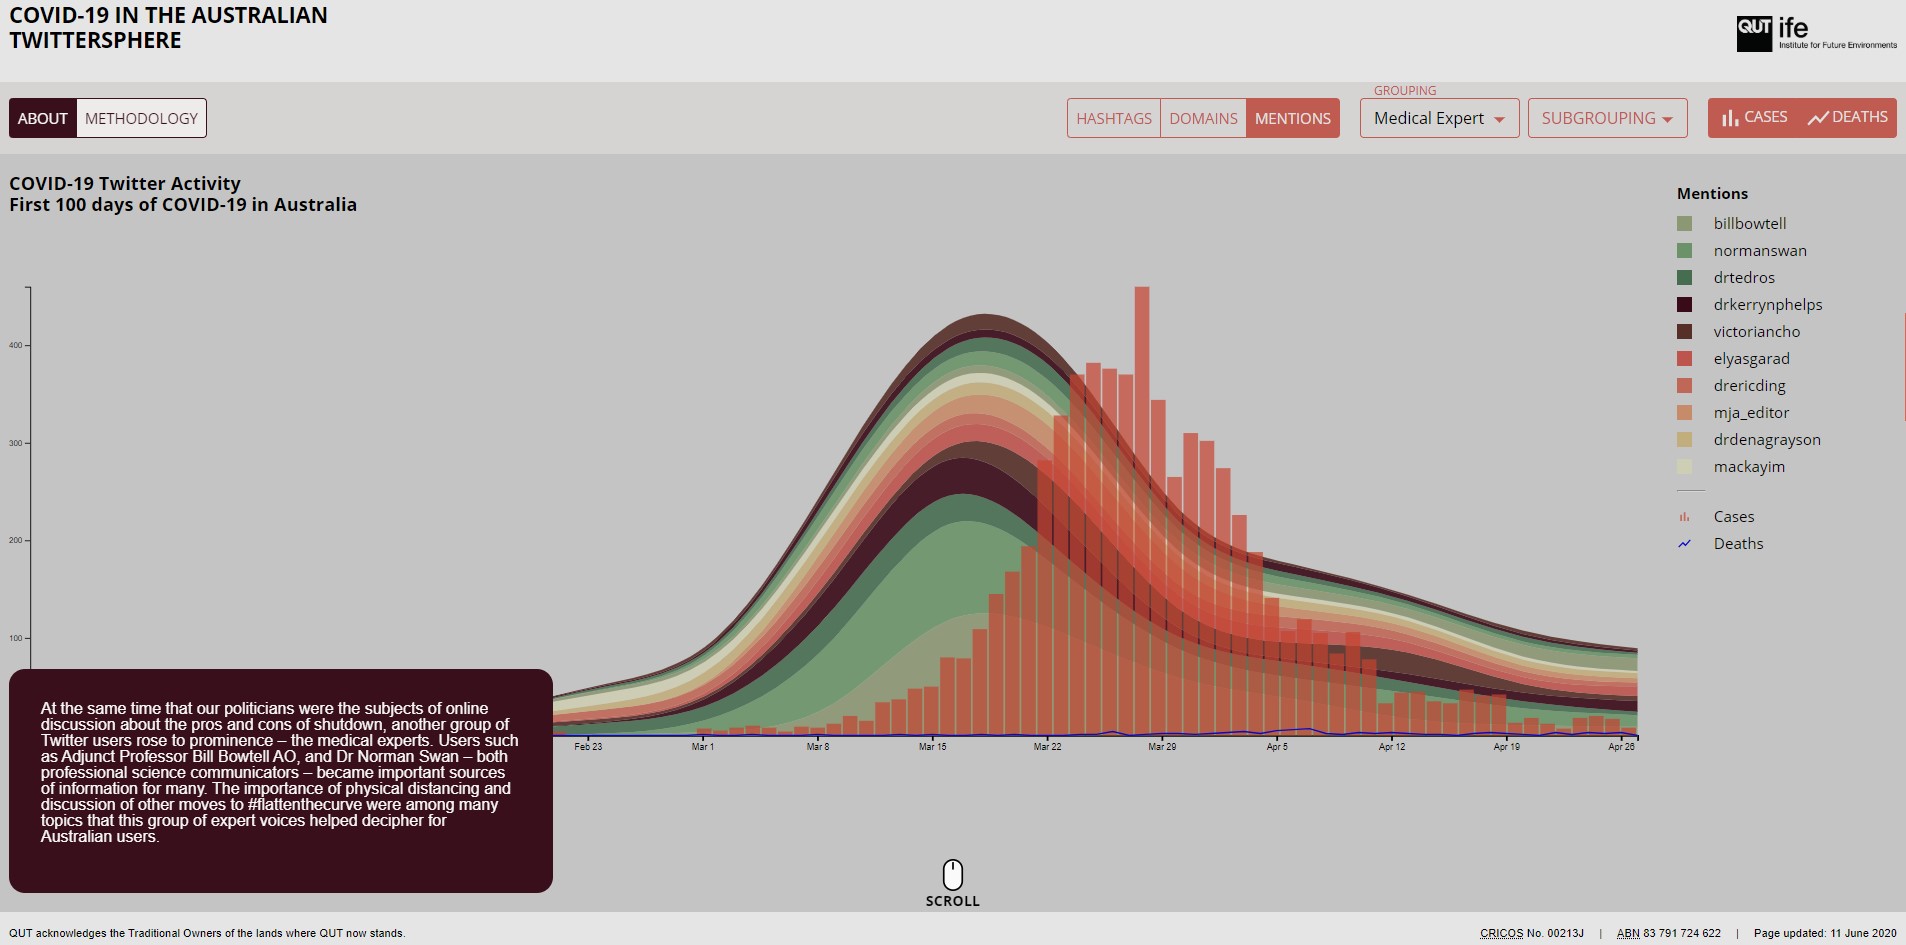
At the same time that our politicians were becoming the target of online discussion as to the pros and cons of shutdown, another group of accounts rose to swift prominence, those of medical experts. Accounts such as Adjunct Professor Bill Bowtell AO and Dr Norman Swan (both professional science communicators) became important sources for information for many.
The importance of physical distancing, and discussion of other moves to #flattenthecurve were amongst the many topics that this group of expert voices helped decipher for Australian users.
Hashtags
The sustained impacts from the virus saw topics including travel, sport, education and the economy trending via corresponding hashtags such as #qantas, #nrl, #afl, #ausecon and others. The volume of tweets using these hashtags follows the general high volume of Twitter activity seen in the mid-March period, with the exception of the travel subgroup. This can be explained by the presence of the #rubyprincess hashtag which has sustained interest following the ongoing issues and investigations surrounding the Ruby Princess cruise liner.
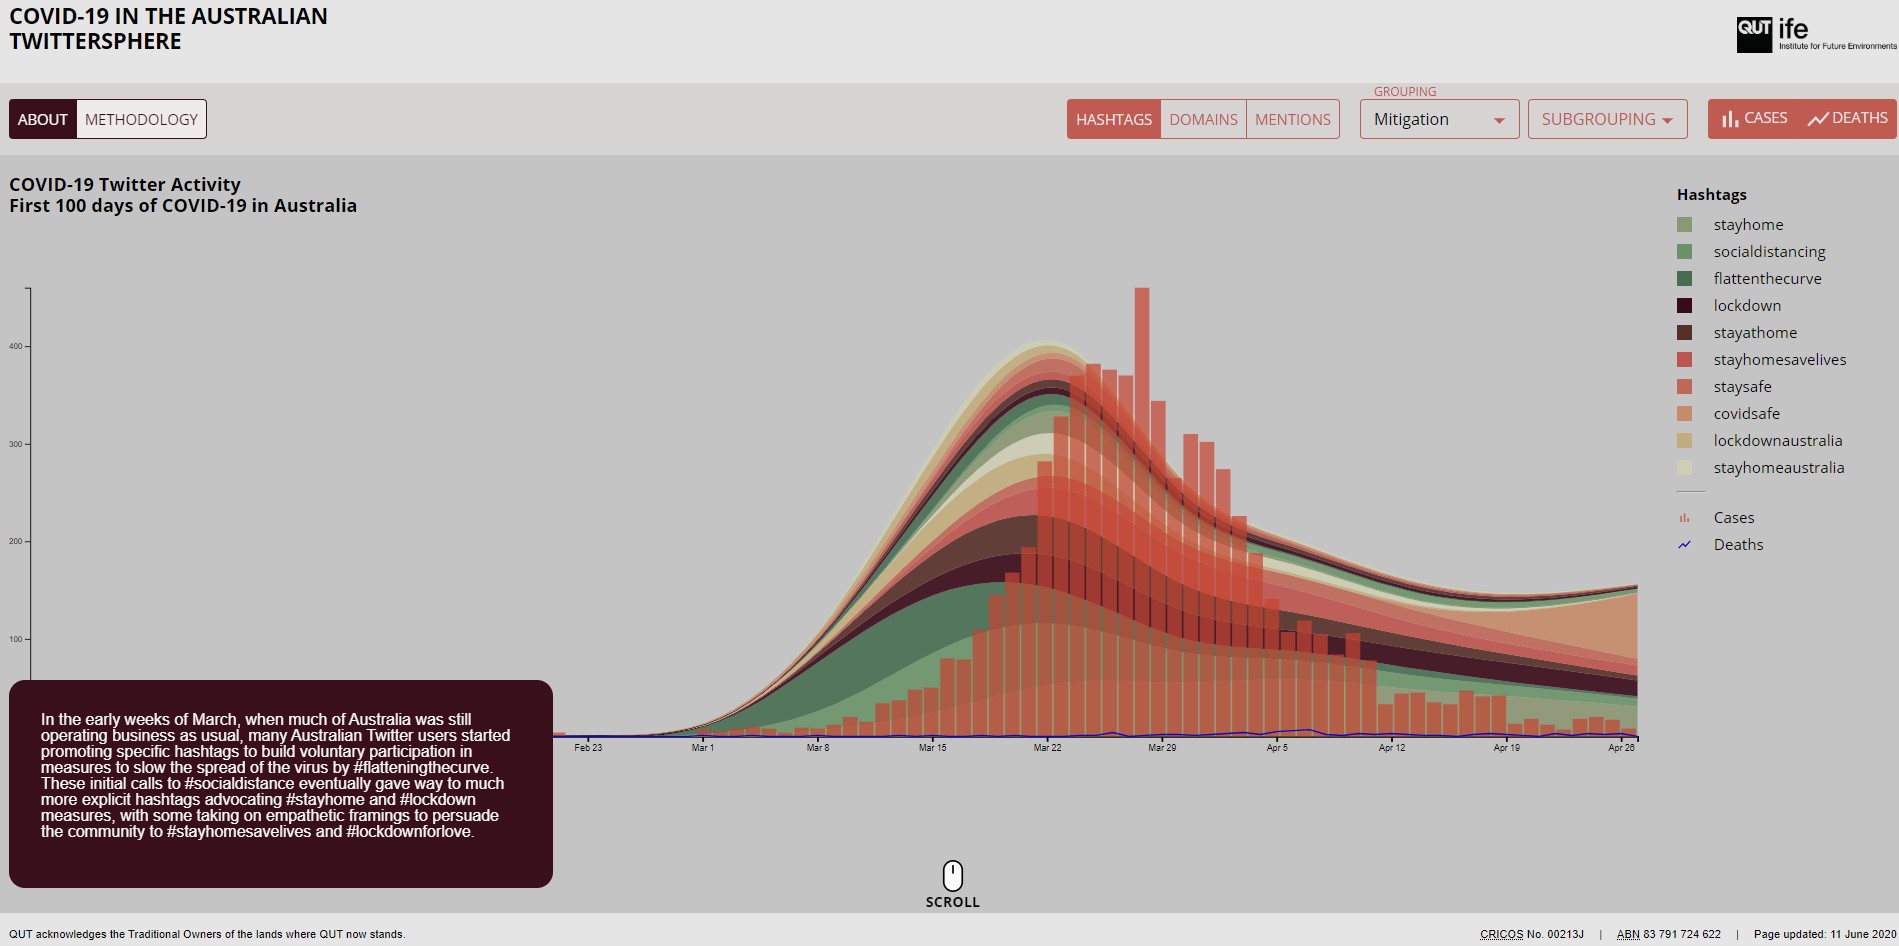
In the early weeks of March, when much of Australia was still operating business as usual, a number of Australian Twitter users started promoting specific hashtags to build voluntary participation in measures to slow the spread of the virus by #flatteningthecurve. These initial calls to #socialdistance eventually give way to much more explicit hashtags advocating #stayhome and #lockdown measures, some taking on empathetic framings to persuade the community to #stayhomesavelives and #lockdownforlove.
URL sharing
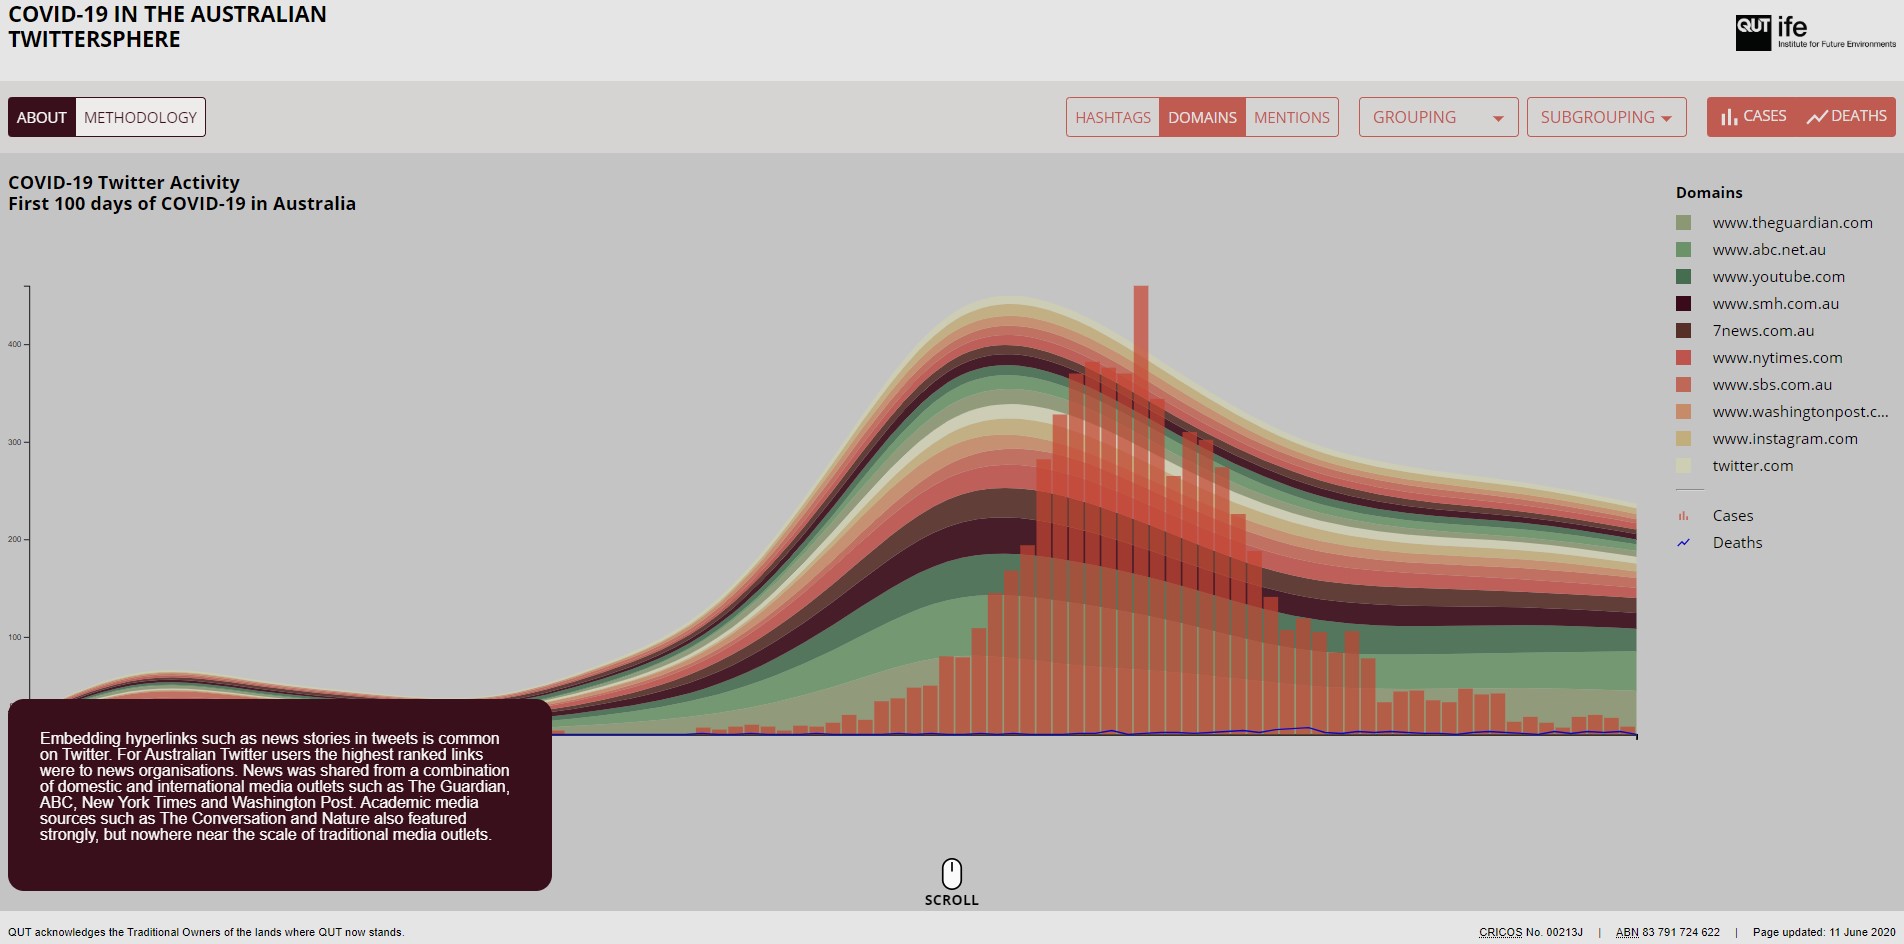
The embedding of hyperlinks in tweets is a common occurrence on Twitter, in particular the sharing of news stories. For Australian Twitter users the sharing of news from international media outlets such as the Guardian (UK), New York Times, and Washington Post was greater than local media such as the ABC, Sydney Morning Herald, and news.com.au. Academic media sources such as the Conversation and Nature also featured strongly, but nowhere near the scale of traditional media outlets.
Twitter can also provide a glimpse into changes in media consumption patterns during the pandemic. The promotion and sharing of podcasts, soundcloud, and Spotify playlists showed once again that in dark times it is the arts that we turn to, to entertain, inspire and nurture us through these most difficult times.
Outcomes
Whilst the online visualisation is no longer publicly accessible, interested researchers can read the QUT News article outlining the findings of the study.
Want to explore the data?
Interested researchers can explore the 100 days of COVID-19 in the Australian Twittersphere dataset here or contact us for further information.